> ## Documentation Index
> Fetch the complete documentation index at: https://rustunnel.com/docs/llms.txt
> Use this file to discover all available pages before exploring further.
# Request Inspector — browse and replay tunnel traffic on localhost:4040
> Every rustunnel session starts a local web inspector on loopback. Browse HTTP requests, inspect headers and bodies, and one-click Replay payloads against your local service — the ngrok :4040 equivalent, built into the open-source CLI.
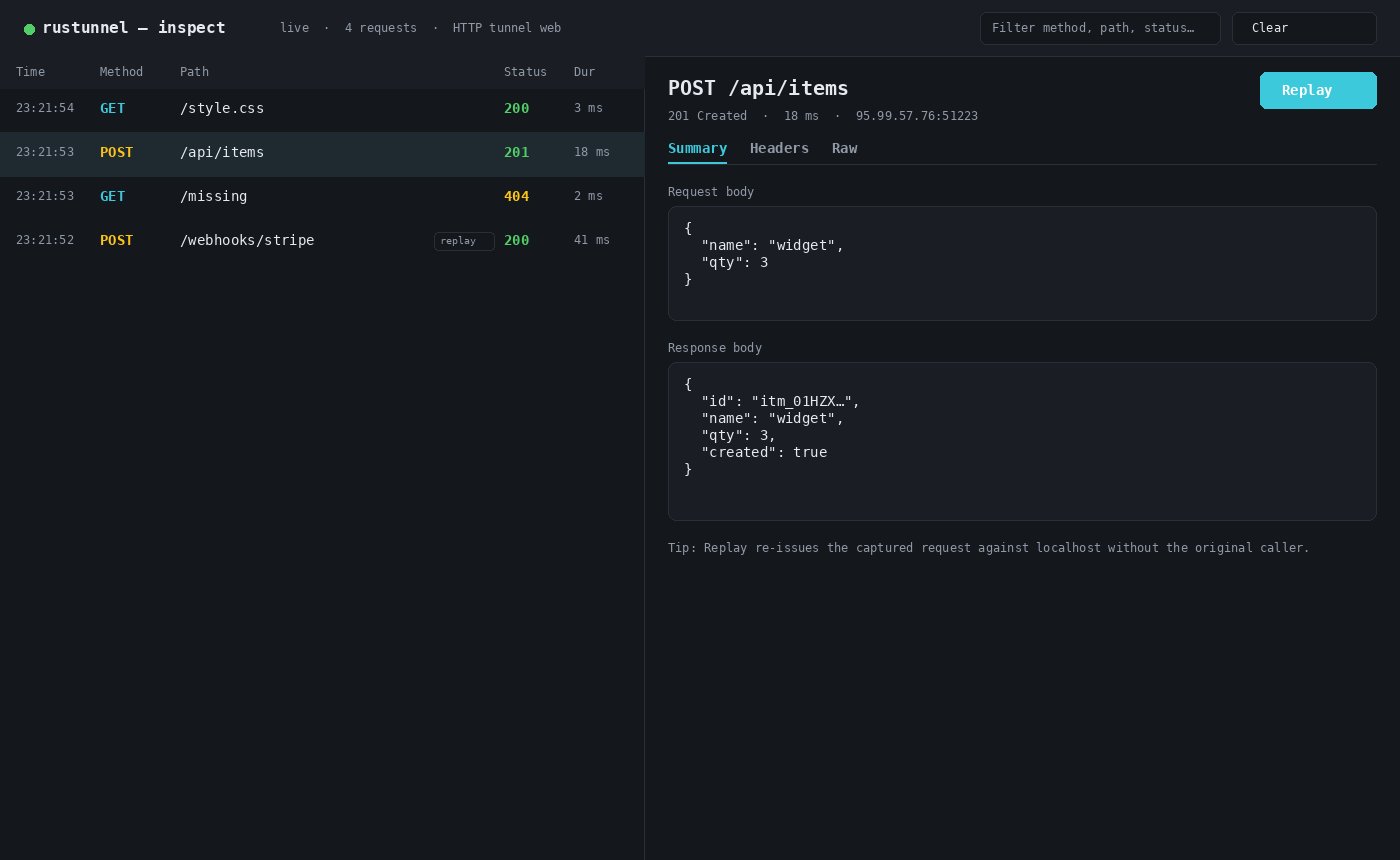
Every `rustunnel` tunnel session starts a small **web request inspector** on loopback. Open it while a tunnel is live to browse the traffic that flowed through, inspect headers and bodies, and **Replay** any request against your local service — without the original caller doing anything.
This is the ngrok `:4040` equivalent, built into the open-source CLI (shipping in **0.8.3**).
## Open the inspector
Start any tunnel as usual:
```bash theme={null}
rustunnel http 3000
```
The inspector URL is printed at startup and shown in the [terminal UI](/docs/guides/client-guide#terminal-ui) header:
```text theme={null}
Inspect http://127.0.0.1:4040
```
Open that URL in a browser on the same machine.
 ## What you can do
* **Request list** — live-updating table with method, path, status, and duration. Filter by method, path, or status.
* **Detail view**
* **Summary** — request and response bodies
* **Headers** — full request and response headers
* **Raw** — reconstructed HTTP messages
* **Replay** — re-issue any captured request against your local service. Ideal for webhook development: trigger once from Stripe/GitHub/etc., then iterate against the same payload. Replayed rows are marked `replay` in the list (and `↻` in the terminal UI).
## What you can do
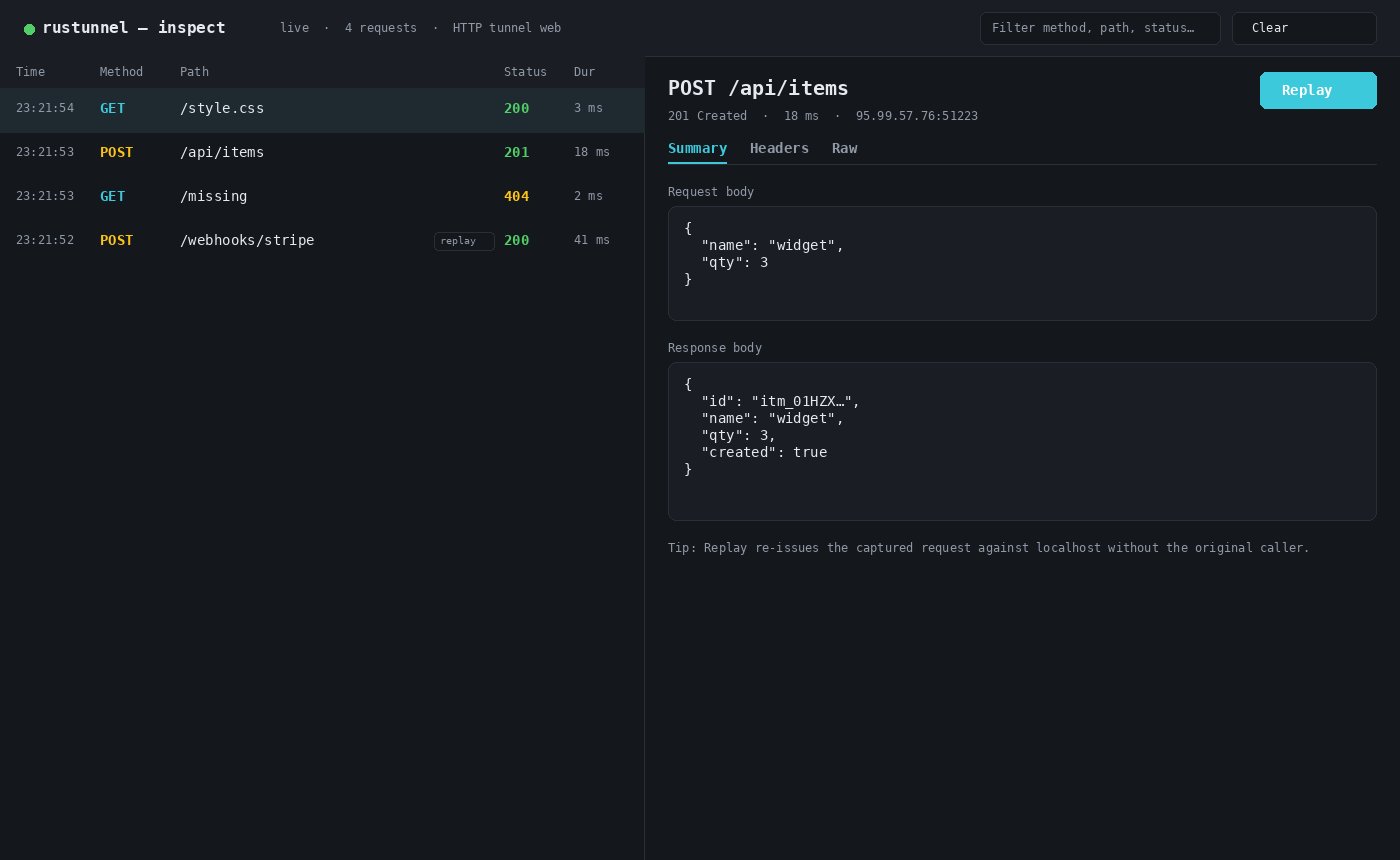
* **Request list** — live-updating table with method, path, status, and duration. Filter by method, path, or status.
* **Detail view**
* **Summary** — request and response bodies
* **Headers** — full request and response headers
* **Raw** — reconstructed HTTP messages
* **Replay** — re-issue any captured request against your local service. Ideal for webhook development: trigger once from Stripe/GitHub/etc., then iterate against the same payload. Replayed rows are marked `replay` in the list (and `↻` in the terminal UI).
 ## Scope and limits
* Captures **HTTP tunnels only**. TCP and UDP tunnels are raw byte streams; they contribute connection and traffic counters in the terminal UI but no request entries here.
* Keeps the **last 500 requests in memory**, per process. Nothing is written to disk and nothing survives a restart.
* Bodies are captured up to **64 KB each**; larger ones are marked truncated (the reported size is still exact). A truncated request body cannot be replayed byte-for-byte.
* WebSocket and other upgraded connections are recorded as their handshake (`101`); frames afterwards are not parsed.
## Configuration
| Flag | Effect |
| ----------------------- | ---------------------------------------------------------------------------------------------------------------- |
| `--inspect-port ` | Bind a specific port (default `4040`). If it is taken, the next free port is used and the real URL is displayed. |
| `--no-inspect` | Disable the inspector entirely. |
```bash theme={null}
# Prefer port 9090 for the inspector
rustunnel http 3000 --inspect-port 9090
# Disable capture on a shared machine
rustunnel http 3000 --no-inspect
```
Because the port can shift when the preferred one is taken, always read the **actual** URL rather than assuming `4040`:
* Terminal UI header (`Inspect http://127.0.0.1:…`)
* Line under the startup box in line mode
* `inspector_ready` NDJSON event in `--json` mode
```json theme={null}
{"event":"inspector_ready","url":"http://127.0.0.1:4040"}
{"event":"tunnel_ready","protocol":"http","public_url":"https://myapp.eu.edge.rustunnel.com","local_port":3000,"local_host":"localhost"}
```
## Security
The inspector binds **`127.0.0.1` only** and has **no authentication**. Treat it as local-only — captured payloads may contain credentials, tokens, and personal data. Use `--no-inspect` on shared or multi-user machines.
## Related
Full CLI reference — terminal UI, flags, config, and reconnection.
Expose localhost in three steps.
Marketing landing for local webhook testing workflows.
Drive tunnels from AI agents in plain language.
## Scope and limits
* Captures **HTTP tunnels only**. TCP and UDP tunnels are raw byte streams; they contribute connection and traffic counters in the terminal UI but no request entries here.
* Keeps the **last 500 requests in memory**, per process. Nothing is written to disk and nothing survives a restart.
* Bodies are captured up to **64 KB each**; larger ones are marked truncated (the reported size is still exact). A truncated request body cannot be replayed byte-for-byte.
* WebSocket and other upgraded connections are recorded as their handshake (`101`); frames afterwards are not parsed.
## Configuration
| Flag | Effect |
| ----------------------- | ---------------------------------------------------------------------------------------------------------------- |
| `--inspect-port ` | Bind a specific port (default `4040`). If it is taken, the next free port is used and the real URL is displayed. |
| `--no-inspect` | Disable the inspector entirely. |
```bash theme={null}
# Prefer port 9090 for the inspector
rustunnel http 3000 --inspect-port 9090
# Disable capture on a shared machine
rustunnel http 3000 --no-inspect
```
Because the port can shift when the preferred one is taken, always read the **actual** URL rather than assuming `4040`:
* Terminal UI header (`Inspect http://127.0.0.1:…`)
* Line under the startup box in line mode
* `inspector_ready` NDJSON event in `--json` mode
```json theme={null}
{"event":"inspector_ready","url":"http://127.0.0.1:4040"}
{"event":"tunnel_ready","protocol":"http","public_url":"https://myapp.eu.edge.rustunnel.com","local_port":3000,"local_host":"localhost"}
```
## Security
The inspector binds **`127.0.0.1` only** and has **no authentication**. Treat it as local-only — captured payloads may contain credentials, tokens, and personal data. Use `--no-inspect` on shared or multi-user machines.
## Related
Full CLI reference — terminal UI, flags, config, and reconnection.
Expose localhost in three steps.
Marketing landing for local webhook testing workflows.
Drive tunnels from AI agents in plain language.