

Installation
From source (recommended)
Requires Rust 1.75 or later.Verify
Quick Start
Configuration File
The client reads~/.rustunnel/config.yml automatically. CLI flags always override file values.
Full example
Field reference
Commands
setup — Interactive config wizard
Create (or overwrite) ~/.rustunnel/config.yml through a guided prompt sequence.
Region behavior:
Behaviour:
- Creates
~/.rustunnel/if the directory doesn’t exist. - If a config file already exists it is overwritten — a backup is not kept, so copy the old file first if you want to preserve it.
- Writes a commented
tunnels:block with HTTP and TCP examples so you can see the structure right away. - Prints
Created:orUpdated:with the full path when done.
setup, uncomment and fill in the tunnels: section then run rustunnel start, or use rustunnel http <port> / rustunnel tcp <port> directly.
http — HTTP tunnel
Expose a local HTTP/HTTPS service through the tunnel server.
Options:
Examples:
tcp — TCP tunnel
Expose any raw TCP service (database, SSH, game server, etc.).
Options: Same as
http except --subdomain has no effect for TCP tunnels. --region still works.
Examples:
start — Multi-tunnel mode
Start all tunnels defined in a config file simultaneously.
Example:
start always reconnects automatically (equivalent to running each tunnel without --no-reconnect). At least one tunnel must be defined in the config file or the command exits with an error.
Multiple backends (load balancing)
Whenstart is given two or more tunnels with the same (group, group_key), the server treats them as one logical pool — inbound traffic is dispatched to a healthy member at random. This is the path for running a hot-spare backend, scaling out a service horizontally behind a single subdomain, or doing zero-downtime rollouts.
Add the load-balancing fields to each pool member’s tunnel definition:
local_port: 3001, the same subdomain, and the same (group, group_key). Both clients register as members of the same pool; public connections to pool.tunnel.example.com are dispatched at random across them.
Load balancing requires
[load_balancing] enabled = true in the server’s server.toml. When the flag is false (the default), the client’s group / group_key / health_check fields are accepted but ignored — both clients try to register as solo tunnels and the second one fails with subdomain '...' is already in use.Quick smoke test
End-to-end validation with two backends sharing one subdomain.1
Build the client from source
2
Drop a config that opts into a group
3
Start backend A and client A
4
Start backend B and client B
Use a second config file that’s identical except for
local_port: 3001.5
Hammer the public URL
6
Validate failover
Kill one of the local backends (Ctrl-C on its
python3 process). The probe loop on that client marks it unhealthy after max_failed × interval_secs seconds; subsequent requests all land on the survivor. Restart the backend — the probe re-registers it as healthy and dispatch distributes again.token create — API token management
Create a new API token via the server’s dashboard REST API. Requires admin credentials.
Example:
Flags Reference
setup takes no flags — all input is collected interactively.
Region Selection
rustunnel can connect to multiple edge servers in different geographic regions. The region selection logic follows this priority order:--server <host:port>— explicit server address always wins; region logic is skipped entirely.--region <id>— connect directly to the named region without probing.region: auto(config file or--region auto) — probe all regions in parallel and pick the nearest.- No region preference — use
server:from config as-is (backward compatible with self-hosted setups).
Available regions (hosted service)
Auto-select output
Whenregion: auto is active, the client probes all regions by TCP connect time and prints:
Region list refresh
The region list is cached at~/.rustunnel/regions.json for 24 hours. On expiry the client fetches a fresh list from GET https://<host>:8443/api/regions; if that fails it falls back to the hardcoded list compiled into the binary.
Reconnection Behavior
By default,rustunnel reconnects automatically when the connection drops. The retry delay follows an exponential backoff schedule:
Each delay has ±20% random jitter to prevent thundering-herd reconnects when a server restarts.
Fatal errors (no reconnect)
The following errors cause an immediate exit — retrying would not help:- Auth failed — invalid or revoked token. Fix: create a new token at rustunnel.com (Dashboard → API Keys) and update your config.
- Config error — missing required fields. Fix: check your
~/.rustunnel/config.yml.
Disabling reconnect
Use--no-reconnect for scripting, CI, or when you want manual control:
Terminal Output
When stdout is a terminal, the client takes over the screen with a live UI. Otherwise — piped output, CI,--no-tui, or --json — it falls back to the
line-based output described further down.
Terminal UI
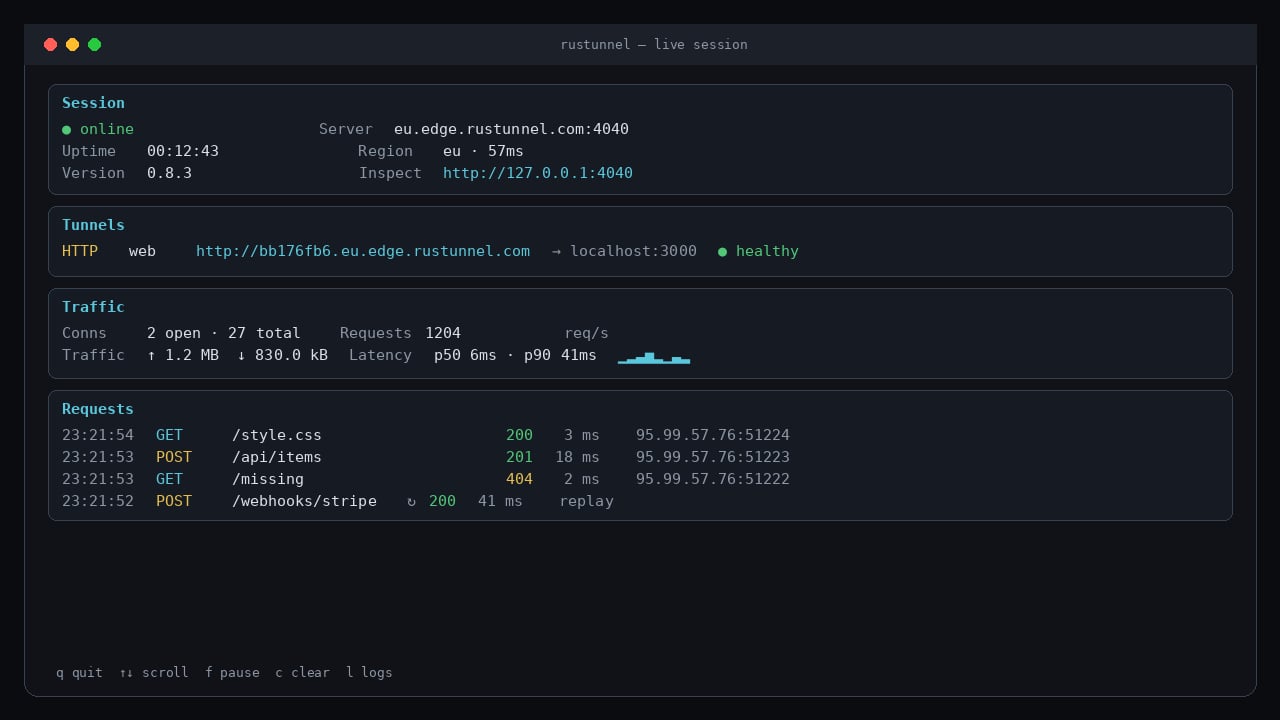
Live terminal UI — session status, tunnels, traffic counters, and a scrolling request log
- Session — connection state, uptime, client version, edge server, region and live control-plane latency (measured from the keepalive round-trip), and the local inspector URL.
- Tunnels — one row per tunnel with its public URL, local target, and health when a
health_checkis configured. - Traffic — open/total connections, bytes each way, p50/p90 request duration, and a requests-per-second sparkline.
- Requests — live log of every HTTP request: time, method, path, status, duration, and the public client address. Replayed requests are marked
↻.
Only HTTP tunnels produce request rows. TCP and UDP tunnels are opaque byte streams, so they show connection and traffic counters only.
Line mode
With--no-tui, a non-terminal stdout, or --json, output stays line-based.
While establishing the connection a spinner is shown:
- Protocol label — bold yellow
- Tunnel name — dim
- Public URL — bold green
- Border — cyan
JSON output (--json)
With --json, the spinner and startup box are suppressed and stdout instead carries NDJSON — one JSON event object per line — for scripts and AI agents:
inspector_ready (url; emitted once at startup when the request inspector is enabled), tunnel_ready (includes public_addr host:port for tcp/udp), reconnecting (attempt, reason, delay_secs), reconnected, error (code, message, hint; exit code 1 follows), and token_created (for token create --json). Diagnostics still go to stderr.
A --json session that also runs the inspector emits it first, so a script can pick the port up before any traffic arrives:
Graceful shutdown
PressCtrl-C to cleanly close the tunnel and exit. The control WebSocket is closed before the process exits. In the terminal UI, q and Esc do the same.
Request Inspector
Every tunnel session also starts a small web inspector on loopback, printed at startup and shown in the terminal UI: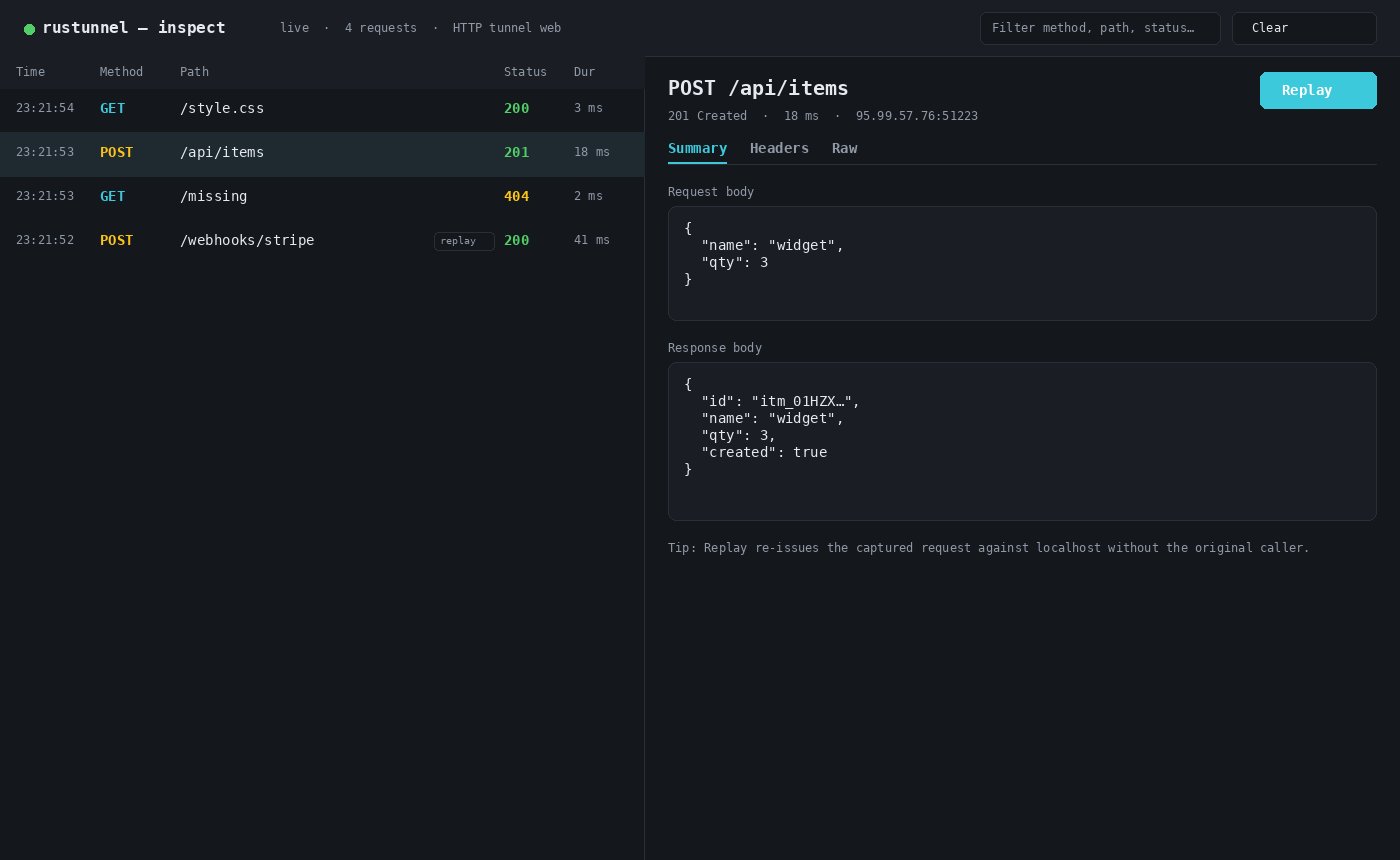
Local request inspector at http://127.0.0.1:4040 — request list and detail with Replay
- Request list — live-updating, with method, path, status, and duration. Filter by method, path, or status.
- Detail view — Summary (bodies), Headers (full request and response headers), and Raw (the reconstructed HTTP messages).
- Replay — re-issue any captured request against your local service without the original caller doing anything. Handy for webhooks: trigger once, then iterate against the same payload. Replayed requests appear in the list marked
replay.
Scope and limits
- Captures HTTP tunnels only. TCP and UDP tunnels are raw byte streams; they contribute connection and traffic counters but no request entries.
- Keeps the last 500 requests in memory, per process. Nothing is written to disk and nothing survives a restart.
- Bodies are captured up to 64 KB each; larger ones are marked truncated (the reported size is still exact). A truncated request body cannot be replayed byte-for-byte.
- WebSocket and other upgraded connections are recorded as their handshake (
101); the frames afterwards are not parsed.
Configuration
Because the port can shift when the preferred one is taken, always read the actual URL rather than assuming
4040 — from the terminal UI header, the line under the startup box, or the inspector_ready event in --json mode.
The inspector binds 127.0.0.1 only and has no authentication, so treat it as local-only — captured payloads may contain credentials, tokens, and personal data. Use --no-inspect on shared or multi-user machines.
Environment Variables
Examples:
Log output goes to stderr. Normal tunnel output (terminal UI / line mode, reconnect messages) goes to stdout.
Error Reference
Troubleshooting
Tunnel connects but requests don’t arrive
- Verify your local service is running and listening:
curl http://localhost:<port> - Check
--local-hostif forwarding to a non-localhost address
Certificate verification failed
If your server uses a self-signed certificate (common for local/staging environments), use--insecure:
Subdomain already taken
The server returnstunnel error: subdomain already in use. Either:
- Omit
--subdomainto get an auto-assigned subdomain, or - Choose a different name:
--subdomain myapp-dev
Debugging connection issues
Enable verbose logging to see full protocol traces:Multiple tunnels on the same server
Userustunnel start with a config file to open all tunnels over a single control connection:
Related pages
Quickstart
Expose your first local port in three steps with the hosted service.
Request Inspector
Browse and replay HTTP traffic on localhost:4040 while a tunnel is live.
Self-Hosting Guide
Run your own rustunnel server with systemd, TLS, and PostgreSQL.
Load Balancing & Health Checks
Pool multiple backends behind one subdomain with automatic failover.